
From the Team @ HPLT 4/7
Markets Update
Woah. Last week was a doozy, this week could very well be a doozy… again. President Trump’s long awaited tariff plan was announced last Wednesday. Here is the crash course: 10% baseline tariff on all imports, with additional reciprocal tariffs being applied on 60 nations. More importantly, the plan included a 34% tariff on China, 32% on Taiwan, 46% on Vietnam, and 20% on all European Union nations. This was not the baseline expectation. In fact, the interpretation on the Trump press conference Wednesday afternoon quickly pointed to a worst-case-scenario relative to what the market was anticipating, which could be described as more nuanced / measured / less drastic. Markets got smoked. Let’s stretch on what that means.
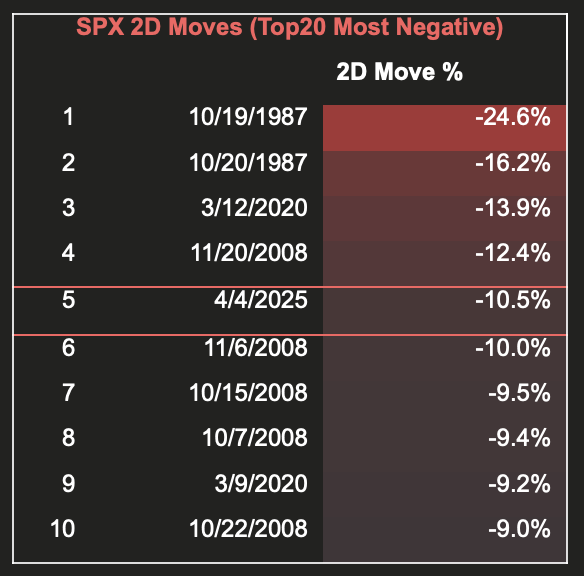
The S&P 500 was down 9.1% ON THE WEEK. The Nasdaq was down over 10%, Dow Jones close to 8%. To put into context how bad Thursday and Friday were in terms of 2-day performance, there is this stat: Thursday + Friday’s move of -10.5%, marks the fifth worst 2-day move in the history of the S&P.
Friday had a definite ‘sell-everything’ global risk-off vibe, with synchronized price action from stock markets around the world. Treasuries were much HIGHER, stocks were much LOWER, and the US Dollar retreated back to multi-month lows with an upward spike in volatility.
Large tariffs increase fears around US centric growth and fully bring inflationary shocks back into the conversation. Higher costs = lower profits… Lower profits are bad. Those costs either get passed on to the consumers (bad for demand, bad for the consumer), or eat into profit margins (bad for corporate earnings). While there is some assumption that concessions will be made in the coming days/weeks, equity markets certainly don’t look ready to price that in just yet.
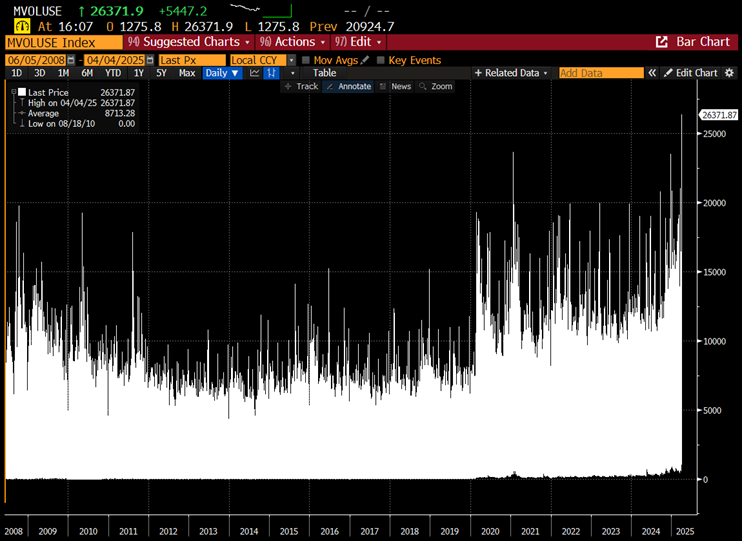
Also worth noting, the price action in the back half of last week was not on muted volumes and participation. Volumes were up ENORMOUS vs what’s typical across exchanges for US equities. In fact, get this: Last Friday was officially the most shares ever traded on a single day in the history of the US stock market, where we saw > 26 BILLION shares trade (see chart below to visualize). The previous record of 23.6b shares was made on Jan 27th, 2021 during peak Gamestop / meme insanity.
A number of equity strategists cut their price targets on the S&P, with most pointing to downward earnings revisions combined with greater uncertainty than any time in recent history, really since Covid. Earnings for the 1st quarter will kick off next week, but the ongoing digestion around tariffs will outweigh those earnings for the time being. In fact, the more relevant piece of this earnings season will be forward guidance as corporates begin to quantify the economic impact of these tariffs on their various business lines for the rest of this year… Ouch.
A Quick Look at Other Relevant Charts on a Historically Bad Week
Leaves very little room for negotiation .. Bearish

Leaves some room for negotiation, chance we see a revision… Bullish

We’ve talked about the MAG7 on here before, largest 7 companies in the S&P by weighting and responsible for a TON of the gains last couple years… now -30% from peak

US-listed ETFs increased +22%, the largest weekly increase in 10+ years

Buzzword flying around all week: Stagflation
Weaker economic growth + higher inflation + high unemployment

Quick check on equity sentiment + consumer sentiment... things happen QUICK


The week is yours; I’ll leave you with this quote I recently read which plays nice right about now: "Peace comes when you stop trying to control the storm and focus on how you steer your ship."